Instant trading guide for Forex newbies. Learn how to trade Forex from start!
![]() Home
Home
![]() Site
Map
Site
Map
![]() About
Us
About
Us
![]() Advertise
with us
Advertise
with us
Forex Resources
![]() Forex
Trading Account
Forex
Trading Account
![]() Forex
Trading Book
Forex
Trading Book
![]() Forex
Trading Course
Forex
Trading Course
![]() Forex
Trading Tools
Forex
Trading Tools
Forex Learning
![]() Introducing
Forex
Introducing
Forex
![]() Reading
Forex Quotes
Reading
Forex Quotes
![]() Margins
Trading
Margins
Trading
![]() Getting
Started in FX
Getting
Started in FX
![]() Forex
FAQ
Forex
FAQ
![]() Forex
Articles
Forex
Articles
![]() More
More
Advertisement
Trading Forex in MACD: Moving Average Convergence/Divergence
MACD uses exponential moving averages (EMA), which are lagging indicators, to include some trend-following characteristics. These lagging indicators are turned into a momentum oscillator by subtracting the longer period of EMA from the shorter period of EMA. Translating the words into mathemathcis, this is how a MACD calculation looks like:
MACD = EMA [shorter period] - EMA[longer period]
The resulting plot forms a line that oscillates above and below zero (positive when EMA[shorter] > EMA[longer] and negative whenver EMA[shorter] < EMA[longer]), without any upper or lower limits. MACD is a centered oscillator and the guidelines for using centered oscillators apply. Besides the resulting plot, a standard signal line (or some call it trigger line) is added in the MACD graph for the indication. In maths form, this is how we get the signal line:
Signal = EMA [certain period] of MACD
Generally, a 12 day EMA is often userd as the EMA[shorter period]; 26 day EMA for the EMA[longer period]; and 9 day EMA of MACD is used as the signal line. These are the standard figures used by the creator of MACD, Gerald Appel, when the technical indicator first used in 1979. Another popular calculation periods in modern days is 7, 13, 5; where EMA[7] is used for the short period, EMA[13] is used for the long period, and 5 days for EMA of MACD (the signal line).
Again, translating words to maths presentation, this is how a standard MACD calculations looks like:
- MACD = EMA [12] - EMA[26]
- Signal = EMA [9] of MACD
Example of MACD graph (source from Investopedia.com Trading the MACD divergence )
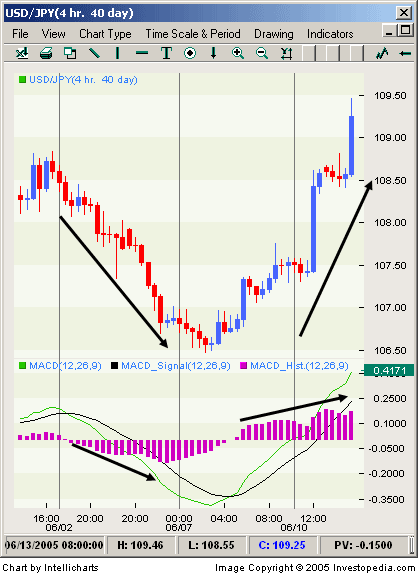 |
|
MACD Indications
Here's how traders take MACD as trading indicators. From the maths of MACD,
- MACD = EMA [12] - EMA[26]
- Signal = EMA [9] of MACD
A bullish signal (buy in signal) is triggered whenever
- A positive MACD (12-day EMA is trading above the 26-day EMA, EMA[12] > EMA[26])
- Moving average positive crossover (MACD is trading above the EMA[9] of MACD)
- Center line positive crossover (MACD=0 and MACD is trading above the EMA[9] of MACD)
A bearish signal (sell off signal) is triggered whenever
- A negative MACD (12-day EMA is trading below the 26-day EMA, EMA[12] < EMA[26])
- Moving average negative crossover (MACD is trading below the EMA[9] of MACD)
- Center line negative crossover (MACD=0 and MACD is trading below the EMA[9] of MACD)
MACD is more than just about market momentum, it also gives the signal in the trend indication.
If MACD is positive and rising, then the gap between the 12-day EMA and the 26-day EMA will be widening. This indicates that the rate-of-change of the faster moving average is higher than the rate-of-change for the slower moving average. Positive momentum is increasing and this would be considered bullish. If MACD is negative and declining further, then the negative gap between the faster moving average and the slower moving average will be expanding. Downward momentum is accelerating and this would be considered bearish.
Often in reality, the Forex exchange price may drop to new selloff low but the MACD does not hit the new low, this maybe the sign of end of bearish. Or vise versa, the Forex exchange price may hit new high but the MACD might not be hitting on the new high point, this often indicates the change of trend from bullish to bearish.
Usage of MACD divergence in Forex trading
The major usage (or benefit) of trading with MACD divergence is that the MACD chart has the ability to overshadow on trend change, which in turn trigger the sell off or buy in signal. Simply said, negative divergence indicates a change of bullish trend to bearish, while a positive divergence indicates a change of bearish trend to bullish. As MACD trading is taking a relative simple approach on the market, MACD is often used along with other technical analysis (stochastic oscillator for example).
Related links and readings
| Wikipedia: MACD General knowledge for MACD learning. Brief intro, calculations, interpretation, and list of other references. http://en.wikipedia.org/wiki/MACD Wikipedia: Moving Average Investopedia: Trading the
MACD Divergence Get Forex trading signal
with FX Universal |
www.golearnforex.50webs.com: Forex Trading Education © Copyright 2006 - 2007 | Site best view in screen resolution 1024 x 768 px